Never a dull moment with Books Ngram Viewer. Pick your favorite topic(s) and try to explain and name valleys and peaks in the Ngram.
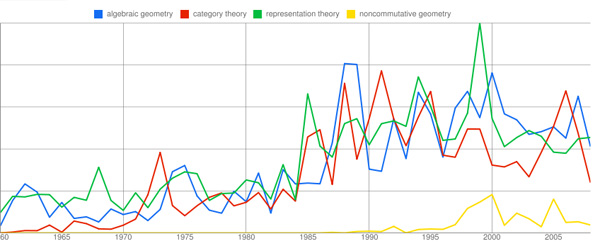
An example. I wanted to compare the relative impact of a couple of topics I love, algebraic geometry (blue), category theory (red), representation theory (green) and noncommutative geometry (the bit of yellow in the lower right hand corner…) from 1960 onwards.

I was surprised to find out that the first three topics were almost in the same impact-league, but then Ngram-viewing can be cruel when you’re biased …
Anyone having an explanation/name for the great depressions of 1982, 1993 and 1996?
On the positive side, what happened in 1988-89 or what caused the representation-peak in 1999, or the category-delirium in 2006?
So far, I’ve only been able to pinpoint a couple of events. My favorite being the red peak in 1973, which I’d like to christen “Grothendieck’s folly”.
2 Comments