No christmas- or new-years family party without heated discussions. Often on quite silly topics.
For example, which late 19th-century bookcharacter turned out to be most influential in the 20th century? Dracula, from the 1897 novel by Irish author Bram Stoker or Sir Arthur Conan Doyle’s Sherlock Holmes who made his first appearance in 1887?
Well, this year you can spice up such futile discussions by going over to Google Labs Books Ngram Viewer, specify the time period of interest to you and the relevant search terms and in no time it spits back a graph comparing the number of books mentioning these terms.
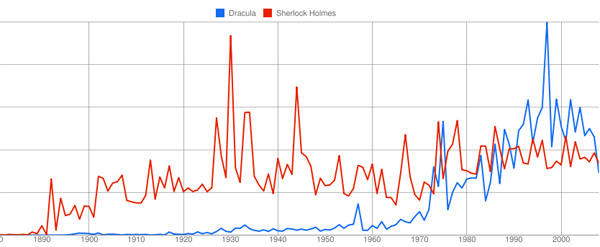
Here’s the 20th-century graph for ‘Dracula’ (blue), compared to ‘Sherlock Holmes’ (red).

The verdict being that Sherlock was the more popular of the two for the better part of the century, but in the end the vampire bit the detective. Such graphs lead to lots of new questions, such as : why was Holmes so popular in the early 30ties? and in WW2? why did Dracula become popular in the late 90ties? etc. etc.
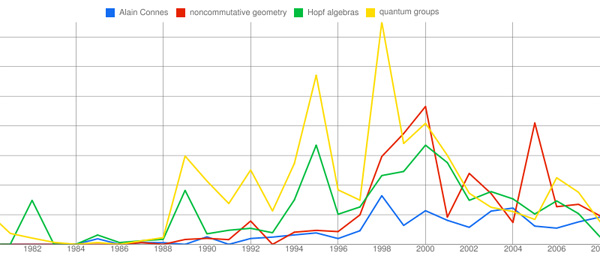
Clearly, once you’ve used Books Ngram it’s a dangerous time-waster. Below, the graphs in the time-frame 1980-2008 for Alain Connes (blue), noncommutative geometry (red), Hopf algebras (green) and quantum groups (yellow).

It illustrates the simultaneous rise and fall of both quantum groups and Hopf algebras, whereas the noncommutative geometry-graph follows that of Alain Connes with a delay of about 2 years. I’m sure you’ll find a good use for this splendid tool…
2 Comments